Landsat Pan Sharpening And Processing
tl;dr MapBox has some nice material on using Landsat 8 imagery. Without previous experience processing Landsat data, I used stuff learned from four of their blog posts. Here are some of my notes, images and a map of some local, recent Landsat imagery…nothing crazy, just a little do-it-yourself red-green-blue, false-color and color-infrared.
Initial inspiration came from Charlie’s two posts this summer - Putting Landsat 8’s Bands to Work and Processing Landsat 8 Using Open-Source Tools. Pansharpening gets you 15 meter resolution and Chris wrote the main steps involved in pansharpening with Orfeo Toolbox and GDAL.
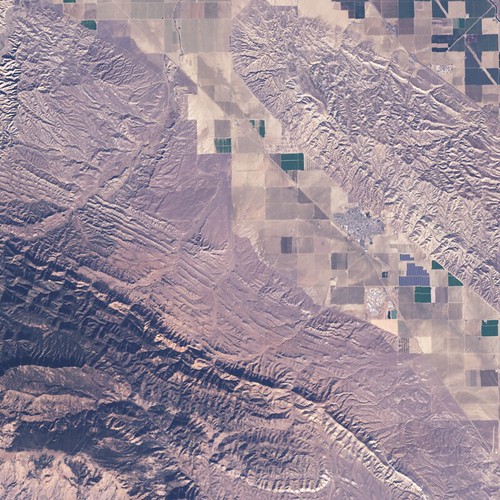
 <p align="center">December 5, 2013 Salinas, CA. False-color combination of NIR, SWIR, and visible red, using bands 5, 6, and 4 + pansharpened, Landsat 8.</p>
I used Mac OS X and was hoping to evoke otbcli from Terminal command line. Thinking I could install Orfeo via Homebrew - it seems at the writing of this post there are various issues with homebrewed Orfeo/Mountain Lion. otbcli is contained within Monteverdi toolbox and I could probably access the applications/utilities from there but I already had QGIS installed and they were available from /Applications/QGIS.app/Contents/MacOS/bin/ on my system, so I used those.
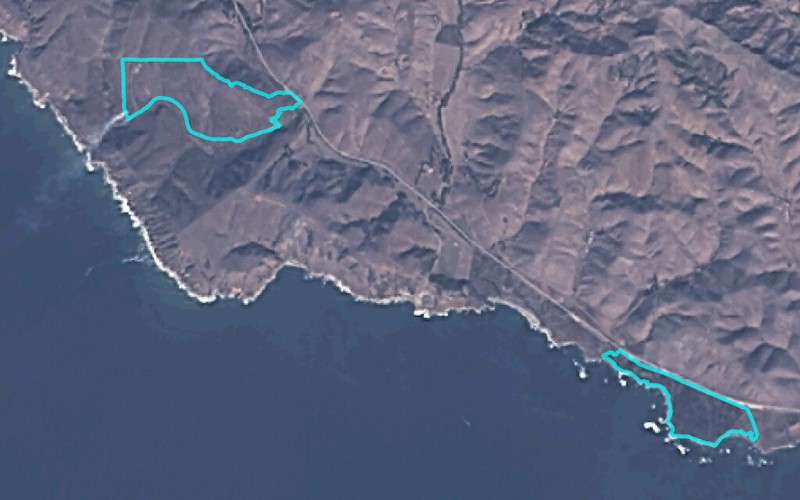 <p align="center">Upper left, Harmony Headlands prescribed burn just getting underway - note the strong offshore winds pushing the smoke southwest. Lower right, Estero rx-burn from November. Image date: December 5, 2013.</p>
Chris’s post involves GeoEye imagery, the code is pretty much he same if you use Landsat except I used this snippet from Derek for converting 16-bit bands (UInt16) to Byte type gdal_translate -ot Byte -scale 0 65535 0 255 -a_nodata "0 0 0" pansharp.tif pansharp-scaled.tif (only parameter that’s different is the scale value was 3000).
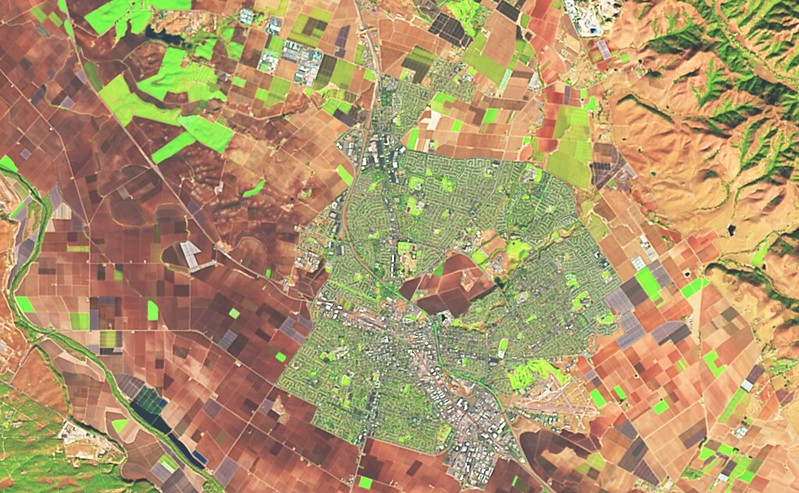
 <p align="center">Wine country, San Luis Obispo County. You can see hints of red as the grape vines lose their leaves.</p>
I ended up using convert -monitor -sigmoidal-contrast 50x12% RGB.tif RGB-corrected.tif for my regular Red-Green-Blue. And convert -monitor -sigmoidal-contrast 33x12% pansharp_3857.tif pansharp_3857-bright.tif for my pansharpened stuff. For those keeping count of those four MapBox posts I mentioned, the last honorable mention is from Processing RapidEye Imagery in Minutes where I used “GDAL one last time to bundle the adjusted image data and the geographical information into a geotiff”. Again, jotted my steps here.
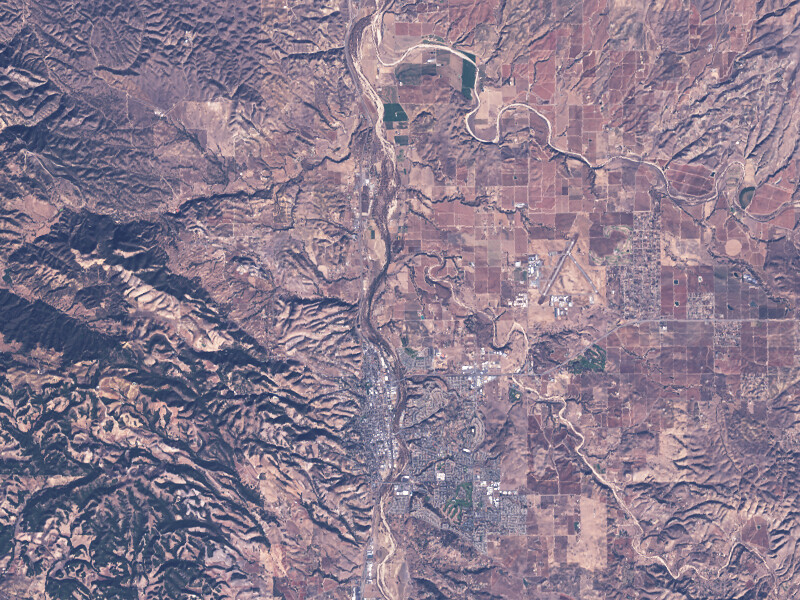
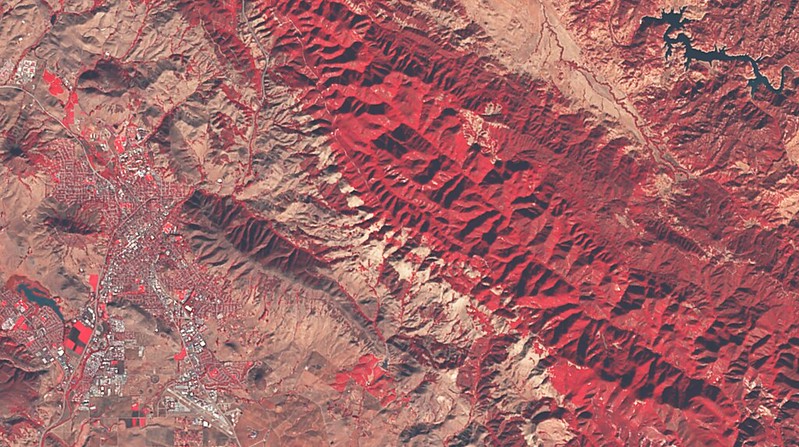 <p align="center">City of San Luis Obispo and Santa Margarita lake, color-infrared.</p>
It does take a bit of tweaking the contrast and brightness but I was happy enough with these quick results. Next, I’d like to recreate the Burned Area Reflectance Classification workflow. Also, more learning about Band Math, bit depth and which tool / which task for weilding Orfeo/ImageMagick/GDAL/? would be good. Check out band combinations for Landsat 8 here.
Note: A wiseman (Charlie) advised a couple things - “Always be a little careful pansharpening false color. The pan band only covers the RGB range, so to the extent that the other bands don’t positively correlate with it, it’s theoretically possible for it to distort their values.” And also, ImageMagick’s -combine flag doesn’t work correctly without a -colorspace RGB flag accompanying it (for some users) .. so heads-up!
Thank you kind internet people who put material out there for people to follow. Without much experience using remote sensing imagery or tools and this is a great way to get your feet wet. Again, the map.